
Yankees games through October 7, 2026. Playoff-field comparisons through October 8.
I picked the Yankees to beat Tampa Bay, thinking that the Yankees' pitching, with the lowest team ERA in baseball, and an offense that had just scored 18 runs against Boston in two games would be capable of overcoming their AL East nemesis.
Then they lost 1-0, 5-2 and 4-3. Five runs in three games, and one hit in the opener.
The warning was there before October
Measured against the other 11 playoff teams, New York had an odd profile. It was fourth in walk rate and fifth in runs per game, but 11th in on-base percentage and last in both batting average and strikeout rate.
| Team | OBP | AVG | K% | Runs/game |
|---|---|---|---|---|
| Brewers | .341 | .258 | 22.0% | 5.14 |
| Cubs | .339 | .251 | 21.1% | 5.25 |
| Dodgers | .338 | .257 | 20.4% | 4.94 |
| Rays | .326 | .258 | 18.8% | 4.54 |
| White Sox | .320 | .236 | 24.1% | 4.79 |
| Red Sox | .319 | .245 | 21.7% | 4.25 |
| Padres | .319 | .244 | 21.6% | 4.46 |
| Guardians | .316 | .239 | 20.8% | 4.19 |
| Astros | .315 | .242 | 21.9% | 4.53 |
| Phillies | .312 | .240 | 21.7% | 4.40 |
| Yankees | .311 | .235 | 24.7% | 4.59 |
| Braves | .309 | .246 | 21.6% | 4.58 |
2026 regular season, the 12 playoff teams sorted by OBP. MLB Stats API; playoff field.
Judge missed most of the summer with a fractured rib, then suffered a calf strain. He played 66 of New York's 161 games. Giancarlo Stanton played 24, and calf injuries kept him out from April 24 through the end of the regular season.
With Judge in the lineup, the Yankees had a .329 OBP. Without him, .298. The league was at .318.
Different opponents and different lineups sit inside those two numbers, so the gap isn't Judge's alone. The point is the depth behind him: .298 is what the rest of this roster produced over 95 games, lower than any playoff team's full-season mark.
The walks were real. Contact was the problem: the lowest average and highest strikeout rate in the playoff field meant too many trips ended with nobody on.
Ben Rice carried the on-base load: .363 in 667 plate appearances, a hair better than Judge's .360. Cody Bellinger finished at .338 in 562.
Then it drops off. Jose Caballero finished at .290 in 456 plate appearances and Ryan McMahon at .279 in 360. Caballero's speed and glove count for something. At the plate, those season-long numbers left the lineup little cushion once Judge and Stanton went down.
Austin Wells was the one late sign of life: a .351 OBP in 168 plate appearances after the All-Star break, up from .247 before it. Over the final 30 games the team's OBP rose to .316, still below the playoff-field median of .319.
Plenty of power, too few hits
This is my thesis: the Yankees are built to hit the ball over the fence, not to put it in play. When the power shows up, that works. When it doesn't, there's very little underneath.
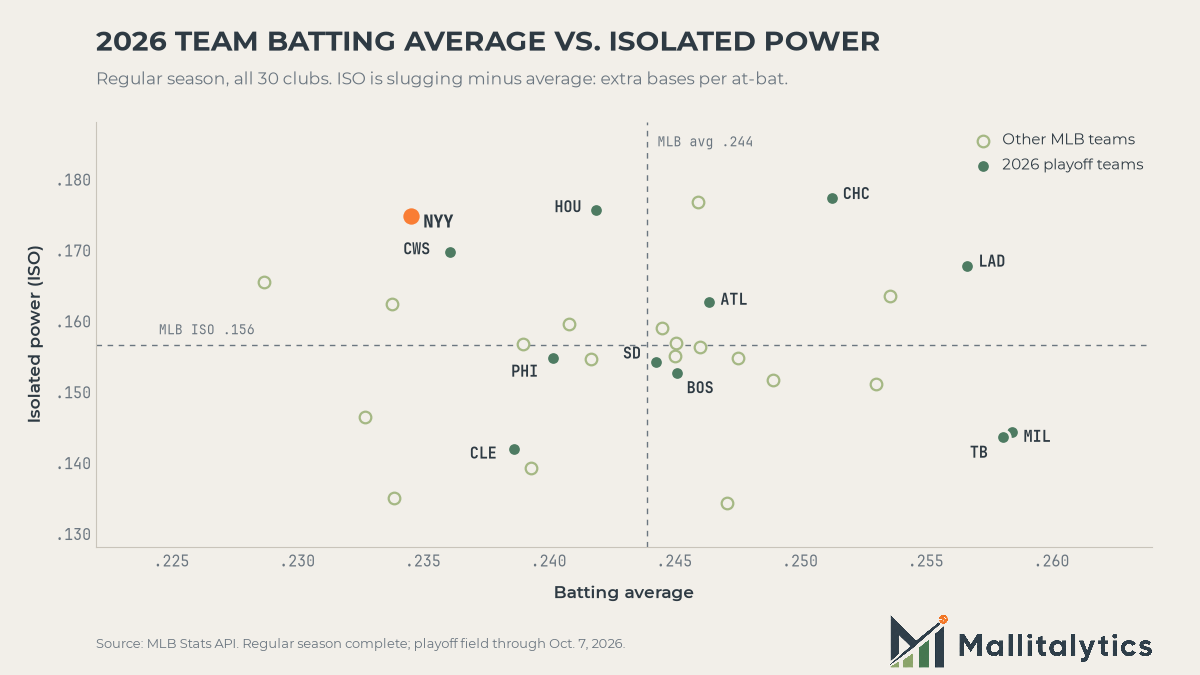
The chart plots each team's batting average against its isolated power (ISO, slugging minus average, so it counts only extra bases). New York was fourth in ISO, 26th in average and 28th in singles per plate appearance.
It isn't a one-year quirk. The singles rank has sat in the bottom third in four straight postseason years and bottomed out at 28th in 2025 and 2026:
| Season | AVG (MLB rank) | ISO rank | Singles per PA rank | Runs per game rank |
|---|---|---|---|---|
| 2021 | .237 (23rd) | 11th | 17th | 19th |
| 2022 | .241 (15th) | 3rd | 24th | 2nd |
| 2024 | .248 (9th) | 3rd | 23rd | 3rd |
| 2025 | .251 (10th) | 1st | 28th | 1st |
| 2026 | .235 (26th) | 4th | 28th | 8th |
Regular-season ranks among 30 teams, for each of New York's last five postseason appearances.
2025 shows the approach can work. The Yankees were 28th in singles rate and still led baseball in runs, because they also led in ISO. In 2026 the singles held steady (13.2 per 100 plate appearances, then 13.1) while extra-base hits fell from 8.8 to 7.8, with Judge and Stanton hurt most of the year. The power dropped, and there was no contact underneath to catch it.
The teams that played best this year didn't have to choose. Milwaukee and Tampa led MLB in average at .258. The Dodgers hit .257 with a .338 OBP and a 20.4% strikeout rate. The Cubs, the top offense at 5.25 runs a game, were sixth in average and first in ISO. And the Rays, who knocked New York out, struck out less than anyone in baseball (18.8%).
The research cuts against the simple version of my argument. Across 150 team-seasons (every club in 2021, 2022 and 2024 through 2026), singles rate barely tracked runs per game, a correlation of 0.06. Power came in at 0.79 and OBP at 0.87. Among the 58 playoff teams in those years, regular-season singles rate didn't predict October scoring either, and FanGraphs' research on playoff rosters finds little evidence of a special postseason recipe. So the case isn't that singles win in October. It's that a lineup with no contact has no floor when the homers stop, and this postseason showed it.
That's where the lineup question comes in. The top of the order isn't the issue: Ben Rice (.363 OBP), Cody Bellinger (.338) and Judge when healthy. The gap is the middle and bottom, where Caballero (.290) and McMahon (.279) played most of the year. Those spots need hitters who put the ball in play and get on, so the lineup turns over with runners on when the top comes back up. I wouldn't ask the whole lineup to give up power for singles. I'd add one or two hitters who make contact.
When the game gets late and stays close
Game 3 is the one that stings. From the seventh inning on, with the score within two runs, the Yankees came up 11 times. They got no hits, one walk and five strikeouts, and lost 4-3.
Across the ALDS they struck out 31 times in 99 plate appearances. Tampa struck out 18 times in 103.
Was that an October problem or a Yankees problem? MLB tracks a "late and close" split: the seventh inning or later, with the batting team tied, up by one, or with the tying run at least on deck.
In this postseason, the Yankees struck out in 8 of 20 late, close trips (40%), with one hit. The other playoff teams combined struck out in 25 of 150 (17%).
Over the regular season, though, those spots weren't worse than usual for New York:
| Team | Late & close K% | Overall K% | Late & close OBP |
|---|---|---|---|
| Red Sox | 19.7% | 21.7% | .338 |
| Dodgers | 19.9% | 20.4% | .337 |
| Phillies | 20.0% | 21.7% | .340 |
| Rays | 21.2% | 18.8% | .359 |
| Padres | 21.4% | 21.6% | .351 |
| Brewers | 23.2% | 22.0% | .340 |
| Braves | 23.5% | 21.6% | .320 |
| Astros | 23.6% | 21.9% | .334 |
| Cubs | 23.8% | 21.1% | .340 |
| Yankees | 24.6% | 24.7% | .363 |
| Guardians | 24.7% | 20.8% | .330 |
| White Sox | 26.2% | 24.1% | .310 |
2026 regular season, the 12 playoff teams sorted by late-and-close strikeout rate. MLB Stats API late-and-close splits; postseason.
New York ranked 10th of 12 late and close, at essentially its 24.7% overall rate, and its .363 OBP in those spots led MLB. So the late strikeouts aren't a special failure under pressure. They're the same high-strikeout lineup from the section above, and in October, against better bullpens, the habit showed up at the worst time. Twenty trips can't prove more than that.
Fielding fundamentals gave outs away
This wasn't one bad night. The Yankees made 97 errors in the regular season, the most of the 12 playoff teams; the Cubs made 61 and the Dodgers 64. In October they made four in five games, the third-highest rate in the field behind Houston and Milwaukee, and all four came in Game 2. Regular season; postseason.
The Yankees made four errors in Game 2. Tampa scored five runs, and only two were earned.
In the first inning, Yandy Díaz reached on McMahon's error at third, then scored on a play that included a Jazz Chisholm throwing error. In the fifth, George Lombard Jr.'s throwing error put a runner on right before Richie Palacios' two-run single.
Ben Rice homered twice that night. Those were New York's only runs.
It wasn't new. In Game 5 of the 2024 World Series, two errors and a failure to cover first turned a five-run lead into a tie, all on unearned runs.
The names repeat. McMahon and Chisholm were part of the on-base problem too, and errors are only a narrow slice of what a fielder does.
Where the Yankees go from here
Judge played 66 games, so the lineup can't be built around him being there. The .298 OBP without him is the gap to close.
The fix isn't less power. It's one or two hitters who make contact and get on base, so the lineup still works on the nights the homers don't come.
Trent Grisham and Chisholm are approaching free agency, and they present different questions. Grisham's .308 OBP came with an 18.4% strikeout rate, already below the league's 22.1%. Chisholm finished at .312 with a 29.5% strikeout rate.
Neither departure is settled. Stanton is signed through 2027, with a club option for 2028, so his spot isn't automatically open either.
I gave too much weight to two big games against Boston. The season-long on-base numbers, and what the lineup looked like without Judge, deserved more of my attention.
Next year's test is simple: fewer strikeouts, more runners on base, and fewer free outs in the field.
Sources: MLB Stats API, MLB.com, Associated Press, FanGraphs and Baseball-Reference. Calculations and contract checks are retained in the accompanying research notes.