
The starter board shows three numbers for every listed pitcher:
- Proj. Malli
- Ace %
- Bust %
They are not three ways of saying the same thing.
Ace % answers the upside question: How often does this start reach ace territory? Bust % answers the risk question: How often does it fall apart? Projected MalliScore gives the expected score in the middle of those possibilities.
That is the simplest way to read the board: start with the two percentages, then use the score and projected line for context.
The three numbers
Ace %
An ace outing is a 59+ MalliScore. It is a strong, complete start: usually real dominance, enough run prevention, and enough workload to carry the game.
Ace % is the probability that a starter reaches that line. A pitcher at 30% is not being predicted to throw an ace every time. He has one of the stronger ceiling paths on that day's slate.
This is the first number to use when you want to find the best upside.
Bust %
A bust is a start that finishes below a 30 MalliScore.
Bust % is the probability of that low-end outcome. It is the number that tells you where the downside lives. A pitcher can carry a good Ace % and still have meaningful Bust %. That is a high-variance start, not a contradiction.
Use Bust % to separate a strong target from a risky one, or to understand why a pitcher with a good projected line is not a clean play.
Projected MalliScore
Projected MalliScore is the expected outing score. It is built from the projected ingredients of a start: workload, strikeouts, walks, contact, and run prevention.
It is useful for comparing the likely shape of two outings. It is not the same thing as Ace %. A pitcher can have a solid expected score but a modest chance of reaching an elite one. Another pitcher can have a lower expected score and a stronger Ace % because his upside is wider.
The projected line next to it, such as innings and strikeouts, gives that expected score a baseball shape.
What MalliScore measures after a game
MalliScore is a fixed score for a completed start. It combines three parts:
- Dominance: missed bats, called strikes, chase, and expected quality of contact.
- Run prevention: traffic and damage allowed.
- Workload: how much of the game the starter carried.
The formula does not change from start to start. Once a game ends, the same pitching line and pitch data produce the same MalliScore every time.
The projection is a separate job: it estimates those ingredients before the game happens.
What goes into a projection
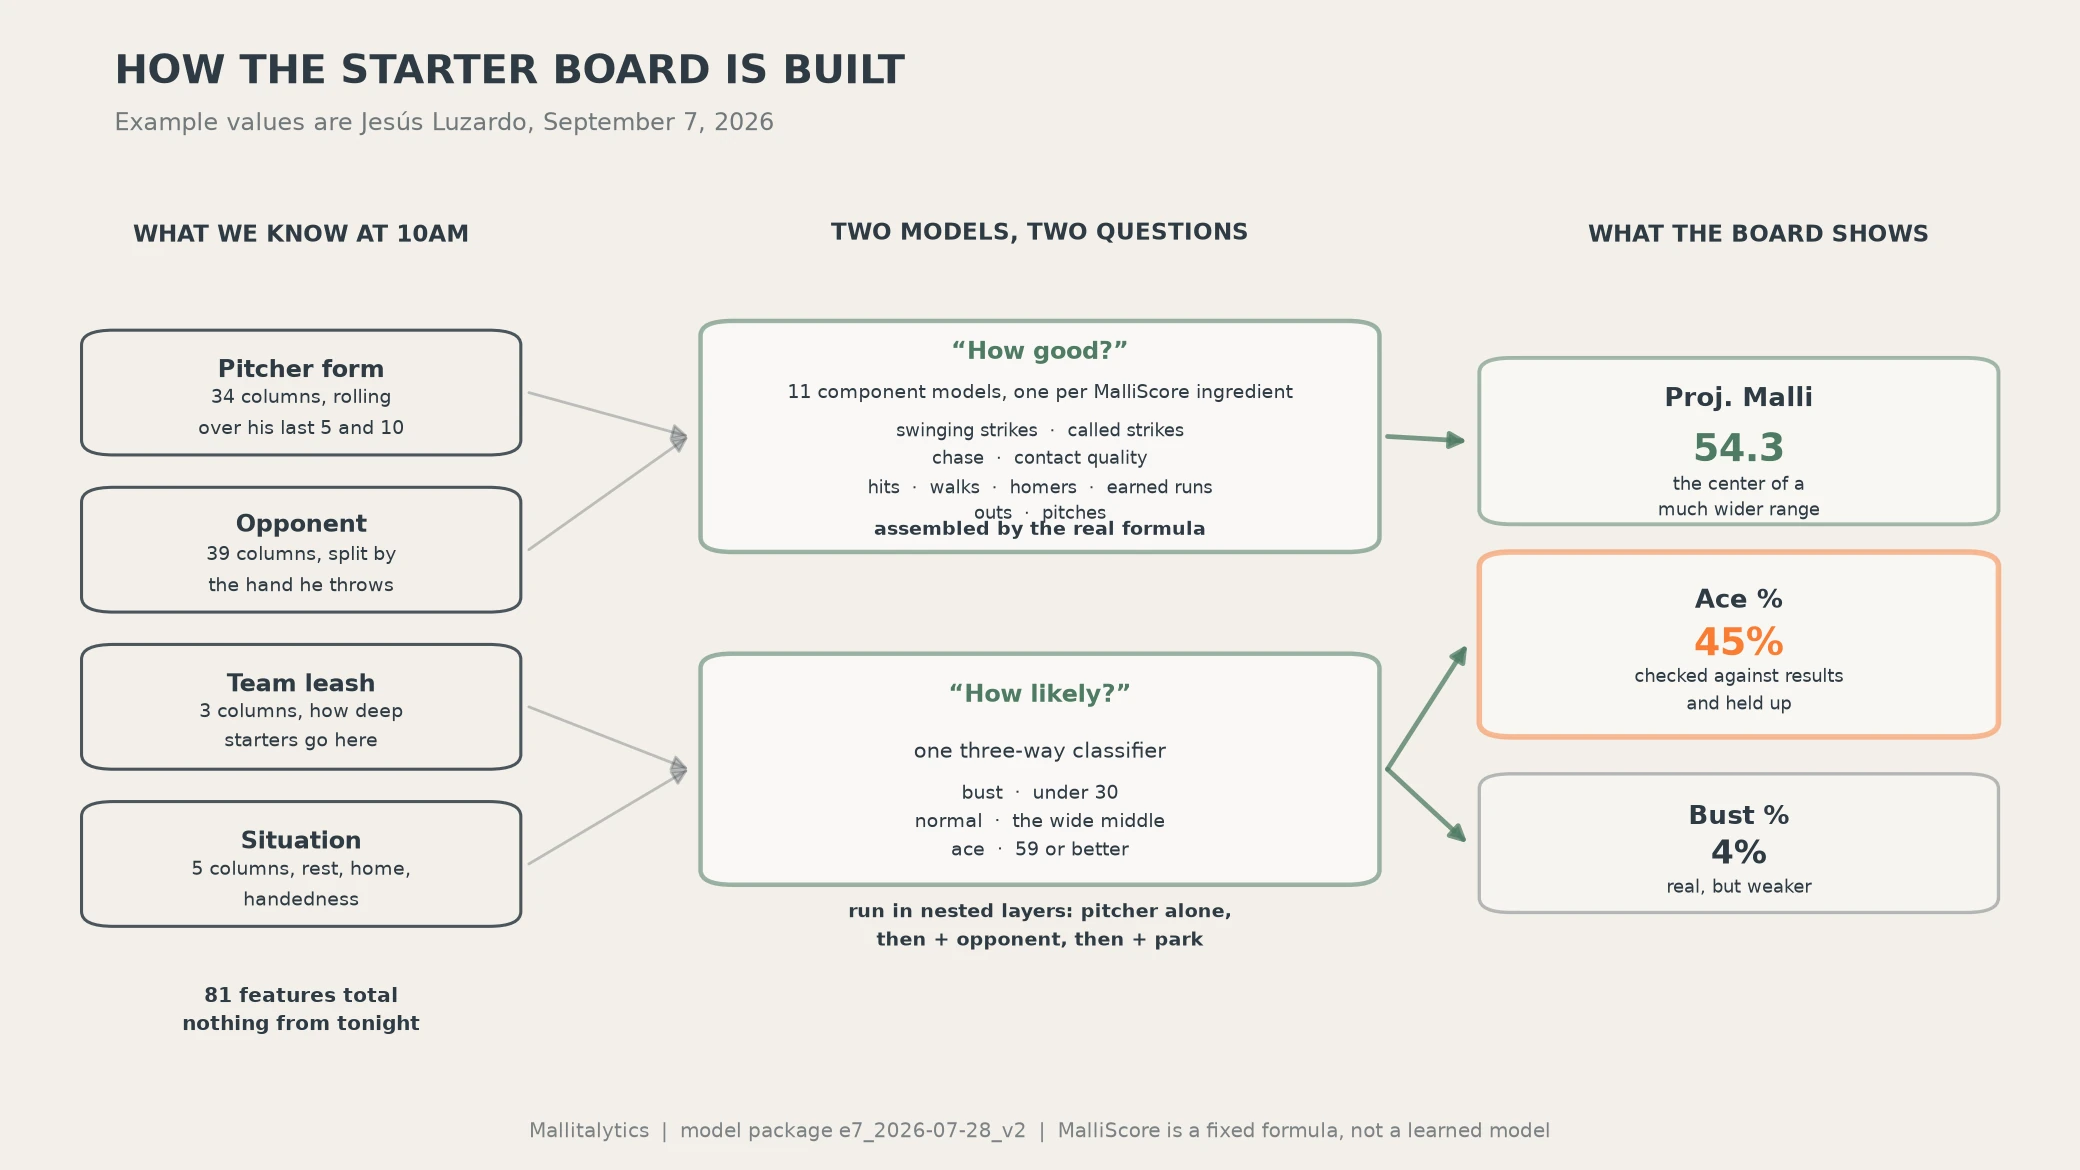
The current September package was trained on 13,750 completed starter outings: every regular-season game from 2024 and 2025, plus 2026 starts through September 10.
It selects 120 pregame inputs from a larger feature set. Those inputs fall into four practical groups.
The pitcher. Season-to-date and recent form: strikeouts, walks, swinging strikes, called strikes, chase, expected contact quality, velocity, workload, and pitch mix.
The opponent. What the opposing offense has allowed or produced in recent windows, including splits by the pitcher's handedness.
The ballpark and game setting. Home or away, ballpark run environment, rest, and starter workload context.
Recent change. Short rolling windows help the model notice when a pitcher is not simply the same pitcher he was two months ago.
Every input is built from games completed before the projected date. A future game cannot appear in a past forecast.
Two models, two jobs
The board is built with two connected systems.
The expected-score side
Eleven component models project the pieces that feed MalliScore:
- outs and pitches;
- strikeouts and walks;
- hits, home runs, and earned runs;
- swinging-strike rate, called-strike rate, chase rate, and xwOBA allowed.
Those projected pieces go through the MalliScore formula to produce the expected score and projected line.
This is useful because the score is not a mystery number. If a projection moves, we can inspect whether the change came from expected workload, strikeouts, contact quality, or run prevention.
The probability side
A separate model sorts each possible outcome into three groups:
- Ace: 59 or higher.
- Normal: the middle range.
- Bust: below 30.
The model returns a probability for each group. The site shows the Ace and Bust values because those are the two decision points most fans care about.
The probability output is calibrated during training on a held-out portion of older starts. In plain language: after the model learns from one group of games, its percentages are checked and adjusted against different completed games before the package is saved.
What updates every day
The inputs refresh daily. Yesterday's completed games change recent form, opponent context, and the day's starter information. That is why today's board is different from yesterday's.
The model package does not retrain every morning. The current package is a named September 2026 version. Keeping it fixed lets us judge its forecasts as a consistent body of work.
When we consider a replacement, it has to clear two checks:
- A time-ordered historical test, where earlier forecasts cannot see later games.
- A forward comparison against real slates before it becomes the live package.
That keeps a new version from looking better only because it learned from the answers it is being asked to predict.
How to use the board
The working scale
- High Ace %: 25% or higher.
- Moderate Ace %: 15% to 24%.
- Low Bust %: 12% or lower.
- High Bust %: 25% or higher.
These are the board's practical flags, not separate MalliScore tiers. In a time-ordered 2026 evaluation of 3,515 starts, the 25%+ Ace group produced ace outings 30.8% of the time, against a 15.4% rate across all starts. The 12% or lower Bust group busted 9.9% of the time; the 25%+ Bust group busted 30.1% of the time, against an 18.3% overall rate.
For a quick read:
- Find the highest Ace %. Those are the strongest ceiling paths on the slate.
- Check Bust %. This tells you how much downside comes with that ceiling.
- Read Proj. Malli and the line. They show the expected shape of the start: length, strikeouts, walks, and runs.
A few examples of the logic:
- 25%+ Ace and 12% or lower Bust: a strong target.
- 25%+ Ace and 25%+ Bust: real upside with real volatility.
- 15% to 24% Ace and 12% or lower Bust: a steadier projected outing.
- Below 15% Ace and 25%+ Bust: the slate's riskier spot.
The goal is not to reduce a start to one number. It is to make the tradeoff visible before first pitch: ceiling, risk, and the expected line between them.
What the board does not know
The board works from the information available at its refresh. A late scratch, a last-minute workload restriction, or any later change sits outside that saved snapshot.