
Two people can produce the same result and deserve very different amounts of credit for it. Every field has some version of this problem. Baseball writes it down every night, in the box score.
Two starts, identical down to the strikeout.
On May 18, 2024, Shota Imanaga went seven innings against Pittsburgh: four hits, one walk, no runs, seven strikeouts. Two months later, Michael Wacha produced the same line against the White Sox. Seven innings, four hits, one walk, no runs, seven strikeouts.
Game Score rates both outings 79. It should. The lines are the same.
The games inside those lines weren't. Imanaga missed bats on 25.0% of his pitches and got Pittsburgh to chase 42.5% of the time. Wacha's figures were 8.4% and 16.3%. One pitcher took contact out of the equation. The other commanded the zone and arrived at the same clean result by nearly the opposite route.
I believe a pitcher who makes hitters miss controls a part of the game that defense and batted-ball luck can't hand him. Run prevention still matters, because dominance without results is incomplete. That belief led me to build MalliScore: a score that can recognize when two pitchers produced the same line by taking different paths to it.
Dominance can produce run prevention. Run prevention does not prove dominance.
That is what MalliScore is built to answer. It asks three questions about one start:
- What did the pitcher control?
- What damage did he allow?
- How much of the game did he carry?
What the box score misses
A pitching line, or a number built from it, can summarize the quality of a start. That's useful, and it's why Bill James created Game Score and why Tom Tango later updated it to handle home runs more directly. It answers a familiar question: How good was the pitcher's line?
What it can't do is separate Imanaga from Wacha. On the dimensions Game Score reads, there's nothing to separate.
That isn't a flaw. It's a second question left open: did the pitcher prevent runs by overpowering the lineup, by controlling contact, or through some blend? MalliScore exists to ask it, as a second opinion rather than a replacement.
What MalliScore measures
MalliScore is a 0-to-100 descriptive index of one starting-pitcher outing. Not a season rating, not a projection, and not a measure of true talent.
To answer that question, MalliScore reads the completeness of a performance through two pillars and a workload adjustment:
- Dominance: how forcefully the pitcher controlled plate appearances.
- Run Prevention: how effectively he kept runners and runs off the board.
- Workload: how much of the game he completed.
Everything below comes from 13,028 starter outings: the complete 2024 and 2025 regular seasons, plus 2026 through August 13. The highest score anyone recorded in that span was 87.4, by Jacob Misiorowski on June 12, 2026. A 100 is the formula's hard cap, not a realistic target or a measure of perfection.
Dominance
The Dominance pillar uses:
- Swinging-strike rate: 30%
- Called-strike rate: 25%
- Chase rate: 20%
- xwOBA allowed: 25%. This estimates what the contact he allowed should have been worth, judged by how each ball left the bat, so lower is better.
Together, these measures record the pitcher winning before a batted ball can hand the outcome to a fielder, a fence, or plain luck.
That choice comes with two qualifications I'd rather state than bury. A called strike isn't purely the pitcher's, since the catcher receiving it and the umpire calling it both matter. And xwOBA allowed, the choice I'm least settled on, estimates damage, so it overlaps with what Run Prevention already measures. I've kept both here rather than quietly move them.
The pillar is narrow on purpose. Ground-ball and weak-contact pitchers can succeed without big whiff totals, but MalliScore credits those clean results in Run Prevention instead.
The reason to weight this side is repeatability. The analysis split each qualifying pitcher-season into alternating starts and asked whether the two halves told the same story. On that scale, 1.0 means a measure repeated perfectly and 0 means pure noise.
- Swinging-strike rate — .810
- Called-strike rate — .684
- Chase rate — .683
- xwOBA allowed — .589
- Earned runs — .371
- Home runs — .266
Across 585 pitcher-seasons of at least eight starts, swinging strikes were the most repeatable thing a starter did. Earned runs and home runs, the raw material of most single-game scores, repeated far less.
That result is why Dominance is half the score: it's built from what a pitcher does again and again, not from what happened to land in front of a fielder.
Run Prevention
The Run Prevention pillar uses:
- Reach Rate Allowed: 40%
- Earned runs: 35%
- Home runs: 25%
Reach Rate Allowed is:
RRA = (H + BB + HBP) ÷ BF
It measures the share of batters who reached. I use batters faced as the denominator because WHIP divides by innings, and innings turn unstable in a very short outing. That's a design choice for a single-start index, not an argument that RRA should replace WHIP everywhere.
Dominance describes the path. Run Prevention records the outcome. It doesn't care how the pitcher escaped: strikeouts, weak contact, sequencing, or a diving shortstop. It notes only that the traffic and damage stayed limited.
Workload
Neither pillar says how much of the game the pitcher carried. Workload does. Completed outs are its main signal, and they multiply the combined pillar score:
- Four innings receives about a 0.70 multiplier.
- Six innings is about neutral at 1.00.
- Seven innings is about 1.04, and nine innings can reach 1.10.
- Pitch efficiency creates only a small variation around those outs-based levels.
The asymmetry is intentional. Six innings is the neutral benchmark, and falling two short of it costs far more than three extra can add. Nobody buys a great MalliScore with innings after giving up real damage.
How the score works
So how do the three become one number? Each input is measured against a 2024 league baseline as a distance in standard deviations, with lower-is-better statistics reversed. The percentages above get applied after that step: MalliScore doesn't multiply a raw 12.9% swinging-strike rate by 30%, it asks how far 12.9% sits from the baseline, then weights that.
Each pillar then lands on a 0-to-100 scale where a baseline outing sits at 50 and every standard deviation moves it 15 points. The two are joined by a harmonic mean, and workload multiplies the result:
Core = (2 × Dominance × Run Prevention) ÷ (Dominance + Run Prevention)

MalliScore = Core × Workload
This is where balance matters. The harmonic mean means whiffs cannot fully hide poor run prevention, and a clean scoreboard cannot hide a lack of control. The weaker pillar drags.
How to read the number
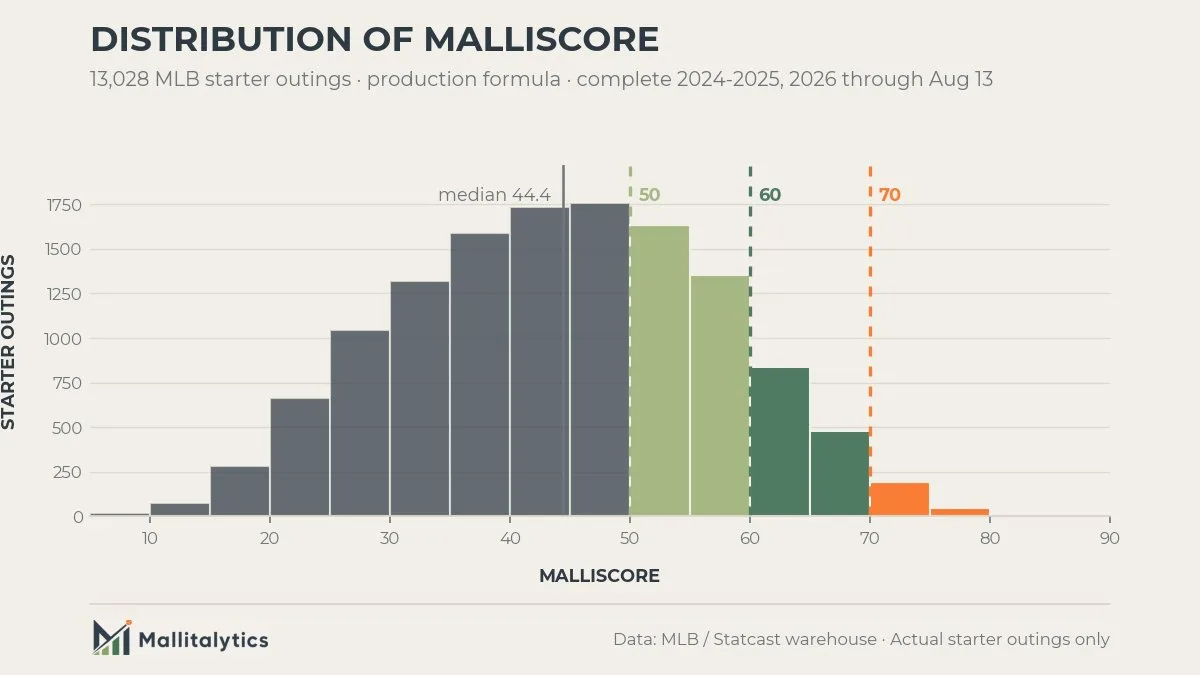
Before returning to Imanaga and Wacha, the scale needs context. Don't read MalliScore like a school grade: a 50 isn't average. The median start scores 44.4, because very few outings pair real dominance with a clean scoreboard and depth.
- Below 50 (Bottom 65%) — Less complete: limited workload, damage, or one weak pillar.
- 50 to 59 (Top 35%) — Strong. Above the typical outing.
- 60 to 69 (Top 12%) — Elite. Result, process, and workload came together.
- 70 or higher (Top 2%) — Rare. Stands out across a full season.
The score gives the level. The pillars give the reason. A 62 built on excellent Run Prevention and ordinary Dominance is a different story than a 62 built on overwhelming bat-missing.
Same line, different performance
Now return to Imanaga and Wacha, with the scale in hand:
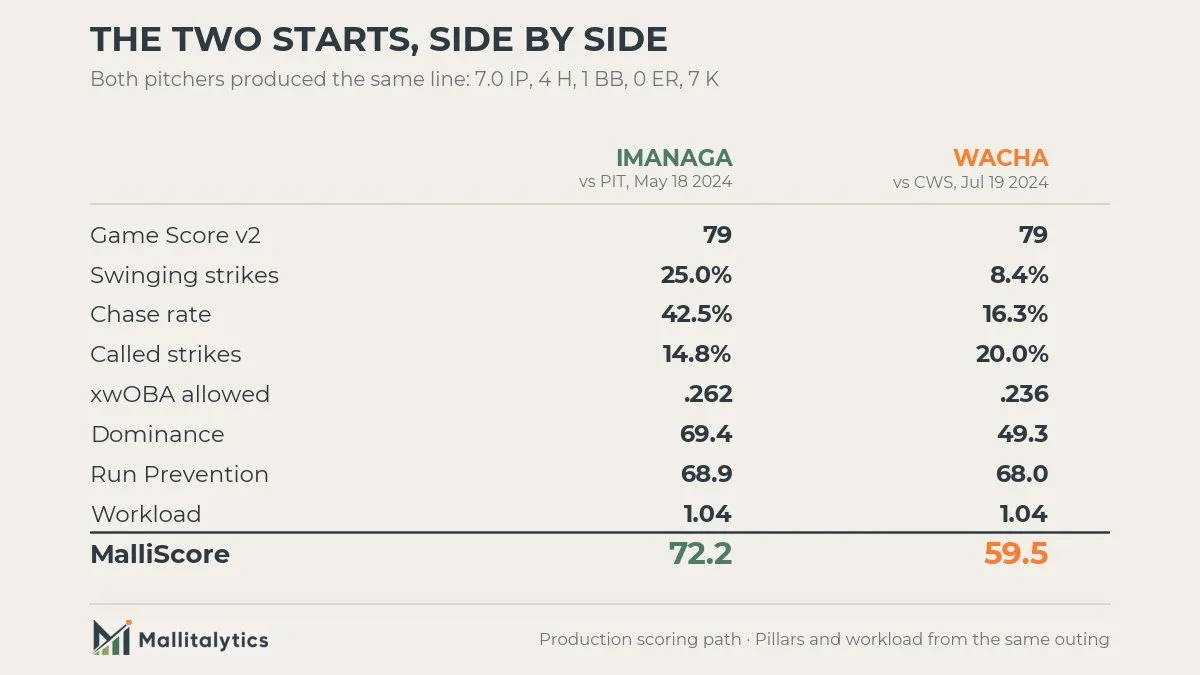
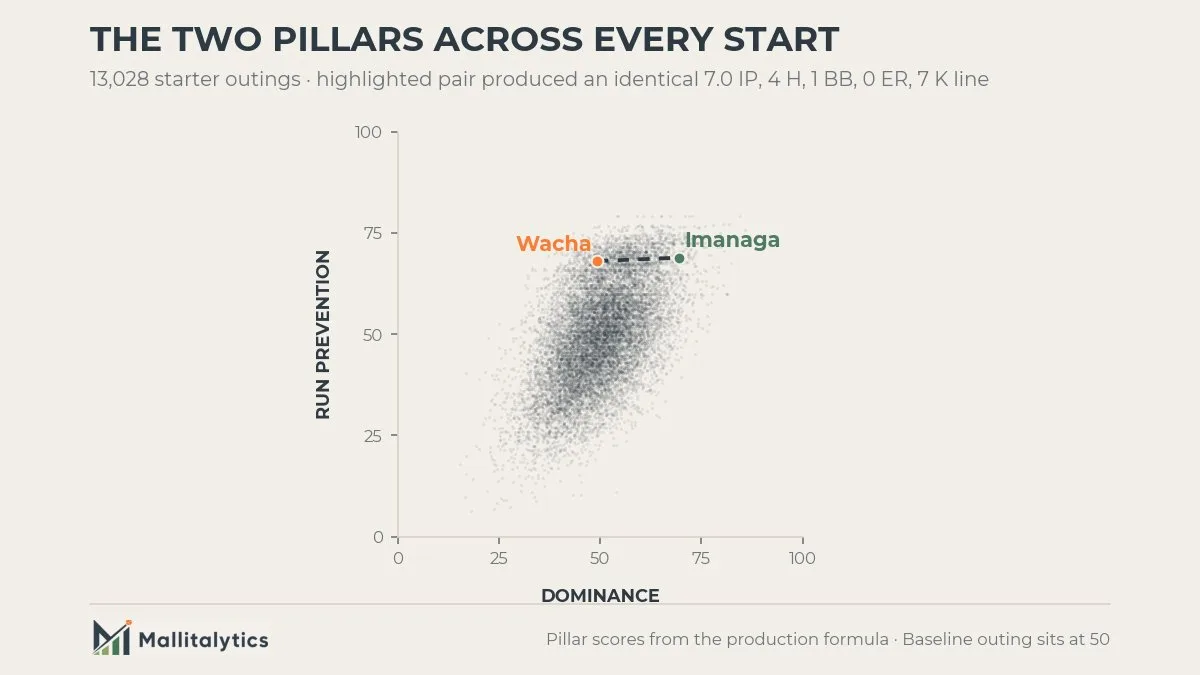
The scale makes the comparison clearer. Run Prevention is nearly identical, which matching lines should produce, and workload is identical. The 12.7-point gap is almost all Dominance.
Wacha still pitched an excellent game. He allowed lower xwOBA than Imanaga and stole more called strikes, working through command and contact management. Imanaga reached the same result with three times the swinging strikes. That puts his start in the top 2 percent of the sample and Wacha's in the top 13. Imanaga gave clearer evidence of controlling the lineup himself.
But is it just agreeing with me?
The example explains MalliScore's purpose. It does not validate the model. I built a score that rewards exactly what I already believed mattered, which is a reason for suspicion rather than confidence. So I ran it across all 13,028 starts and tried to break it.
It agrees with the benchmark. Season-level rank correlations with Game Score v2 were .933, .929 and .928. That's the result I wanted: a score that constantly disagrees with Game Score is probably just broken.
It holds together better across a season. Measured the same way as the inputs earlier, across 520 pitcher-seasons of at least 10 starts, MalliScore reached .691 against .573 for Game Score v2, a paired difference of +.118 with a 95% confidence interval from +.082 to +.159.
That confirms something rather than discovering it. Game Score is built almost entirely from earned runs, hits, walks and home runs, the least repeatable rows in the table above. MalliScore gives half its weight to the most repeatable ones. A score built on stable inputs should come out stabler, and it did. That verifies the construction, not the verdict.
The weights aren't carrying it. Re-weighting the inputs 20,000 different ways across 2024 never dropped rank agreement below .965. The ordering survives almost any reasonable version of my percentages, so the argument doesn't rest on my having picked the right ones.
The scale doesn't drift. The baselines come from the 2024 outings the study was built on, not the complete seasons above, and have stayed frozen since. Applied through 2026 they still hold: the median sat at 44.6, 44.3 and 44.4. The scale you learn this year means the same thing next year.
And the belief came back narrower than I wanted. I tested the tempting version of it, that more missed bats in one start should promise a higher floor in the next. It didn't survive. Neither score predicts the next start at all: after controlling for recent form, MalliScore added nothing about a pitcher's next swinging strikes, xwOBA, K-BB% or WHIP, and Game Score added nothing either.
So dominance earns its weight for describing how this outing was controlled, and for nothing beyond that. It's a smaller claim than the one I started with. It's also the one the evidence actually supports.
Where it stops
The validation establishes where MalliScore helps. Its design choices establish where it stops. The two qualifications from the Dominance section are live questions, not settled ones: a pitcher throwing to an elite receiver carries a framing edge the score can't isolate, and xwOBA allowed still sits in a pillar it may not belong in.
Beyond those:
- Soft-contact specialists can prevent runs without matching the profile MalliScore most rewards.
- Length is baked in. Completed outs are an intentional part of the definition.
- The score is for starters. Relievers need different workload expectations.
- 2026 runs through August 13, not the full season.
None of that is buried. It defines where the score is useful and where it stops.
What to watch
So what do you do with it on a Tuesday night?
You get a second reading of a game you already watched. The line tells you what happened; MalliScore tells you how much of it belonged to the pitcher.
Those boundaries define the right use case. Start where MalliScore and the box score disagree, because that's where it earns its keep. The starts MalliScore preferred averaged 12.8% swinging strikes, 5.9 innings and 3.2 earned runs. The ones Game Score preferred averaged 10.5%, 4.7 innings and 1.2 earned runs.
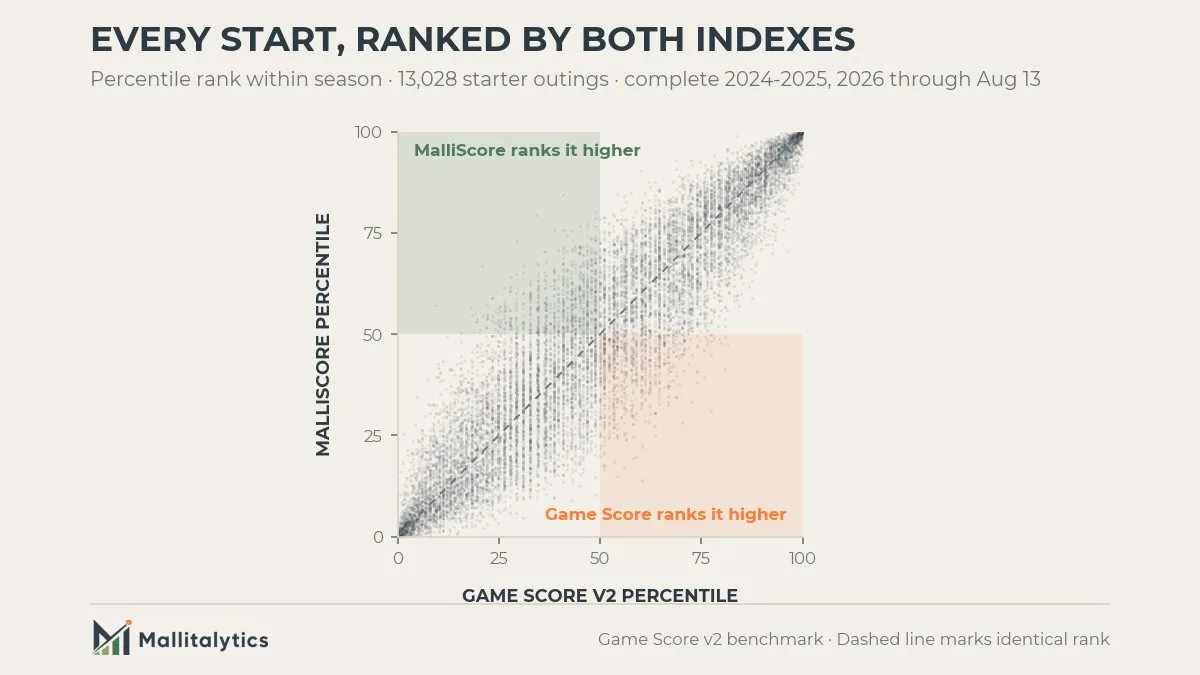
MalliScore leans toward the longer, more dominant outing that gave up some damage. Game Score leans toward the shorter, lower-whiff one that kept the scoreboard clean. Neither lean is right in general, so the disagreement is the useful part: was this start impressive because of the result, or because of how the pitcher controlled the game?
When they agree, the outing was probably what it looked like. When they split, check which pillar caused it. A Dominance-driven gap means the pitcher was beating hitters and something else put runs on the board. A Run Prevention-driven gap means the line flattered him.
If you play fantasy
For fantasy managers that distinction has a practical use. MalliScore puts workload, missed bats and run prevention in one place, and those drive innings, quality starts, strikeouts and the ERA-WHIP side of the ledger. It won't tell you whom to start tomorrow. It tells you how much to make of yesterday.
Back to the two starts
That brings the article back to the three questions from the beginning. What did the pitcher control? Dominance. What damage did he allow? Run Prevention. How much of the game did he carry? Workload.
Imanaga and Wacha answered the last two identically. They answered the first one completely differently, and that's the game the box score couldn't show you.
Game Score asks how good the line was. MalliScore asks how the performance was built. Baseball has room for both questions.
The next time a pitching line looks clean, the interesting one isn't whether he pitched well. It's how much of it he did himself.